User performance
There are various ways to track what a specific user has done in the system, and when. You might want to track user performance for staff incentive schemes or internal user stats. There are a number of really useful reports that highlight user performance in ResRequest.
Audit Trail
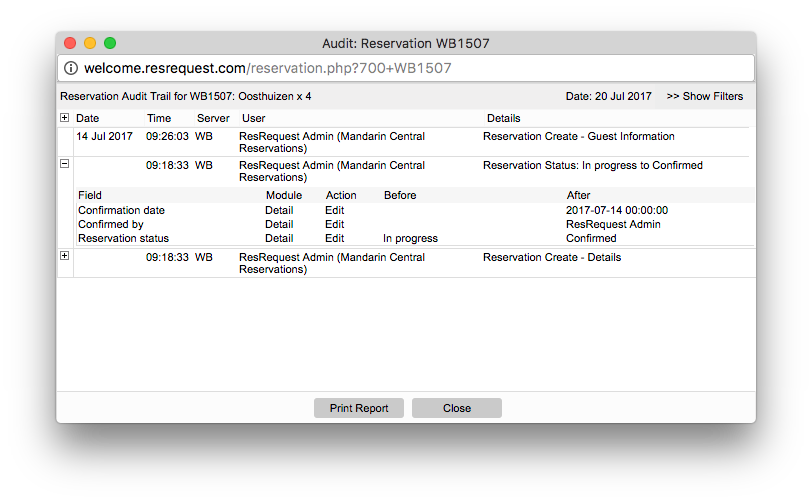
Every reservation has an Audit Trail. The Audit Trail is an activity log, which tracks all changes made to a reservation from the moment the reservation is created.
The Audit Trail can easily be accessed from a reservation.

When you click on the Audit Trail button, a pop-up appears with the Audit Trail for the reservation you are currently viewing. The Audit Trail log includes when a change was made, the environment the change was made in, the user who made the change and the details of the change.

To track a specific type of change across the entire system (such as all rate amount overrides), use the Audit Trail Report. To access this report, navigate to Reports > Audit > Audit Trail.
Update Report
The Update Report is used to generate a list of all new or amended (or both) reservations. You can use this report to track new and amended reservations for a particular day, or for a particular consultant.
If you are using this report to gather consultant stats, you could generate the Financial Report to include the revenue value for all new reservations, for a specific date range.
Take a look at the General reservations reports tutorial to learn more about the Update Report.
Login Stats
The Login Stats report shows you who logged in to your ResRequest system and when.
You can view this information for internal users (staff), external users (agents) and public users. To access this report, navigate to Reports > Audit > Login Stats.
To find out more about how the different user types are set up and how to manage their access to your system, see the User access section.
Financial Report (consultant stats)
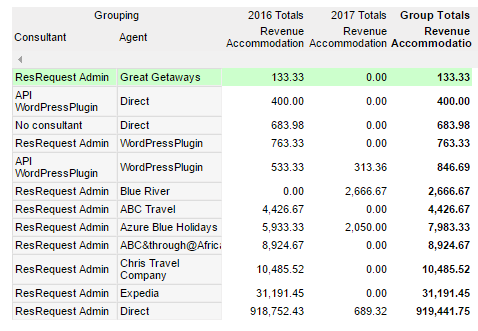
Many of our clients have set up a report to compare consultant performance. This report usually ties in with the company’s incentive scheme or for general comparative statistics.
One option for this report, which is widely used, is to compare revenue generated per consultant, per month. These figures may be split into direct sales and agent sales.
The recommended option to extract this type of data is the Financial Analysis Day report.
Here is an example of what information a report like this could display.

This report is a great one to use as it gives you more than just your consultant revenue stats. If you include the API “consultants” you will be able to see how much revenue is generated through your direct online connections as well. For more on your API connections and online options, see the Channel Management module.
Keep up to date with us
Menu
Visit our website
ResRequest Modules
- Business Intelligence
- Central Reservations
- Channel Management
- Customer Relationship Management
- Developer
- Email Series 2022
- Email Series 2023
- Financial Management
- Marketing tools
- Payment Gateways
- Point of sale
- Product
- Professional Services
- Property Management
- ResConnect
- ResInsite
- ResNova
- System Setup
- Technical Alerts
- Technical Tips
- Telephone Management
- Webinars Index


