Sales Overview Dashboard
The Sales Overview Dashboard will give you insight into the financial performance of your accommodation revenue.
Accommodation, Revenue and Yield chart
This chart compares revenue and yield for different periods. This is a quick way to see how your business is performing. For example, you could generate the report to view the performance of a specific property this year, compared to last year.
This chart is fully customizable, so it’s important to apply the correct filters, so you can see the information you’re looking for.
Once you’ve applied the required filters, you’ll have a stunning report which would have otherwise taken ages to compile!
Here’s an example of this chart, which has been generated for all confirmed bookings, for all properties in the system, comparing revenue and yield from 2019 and 2020:
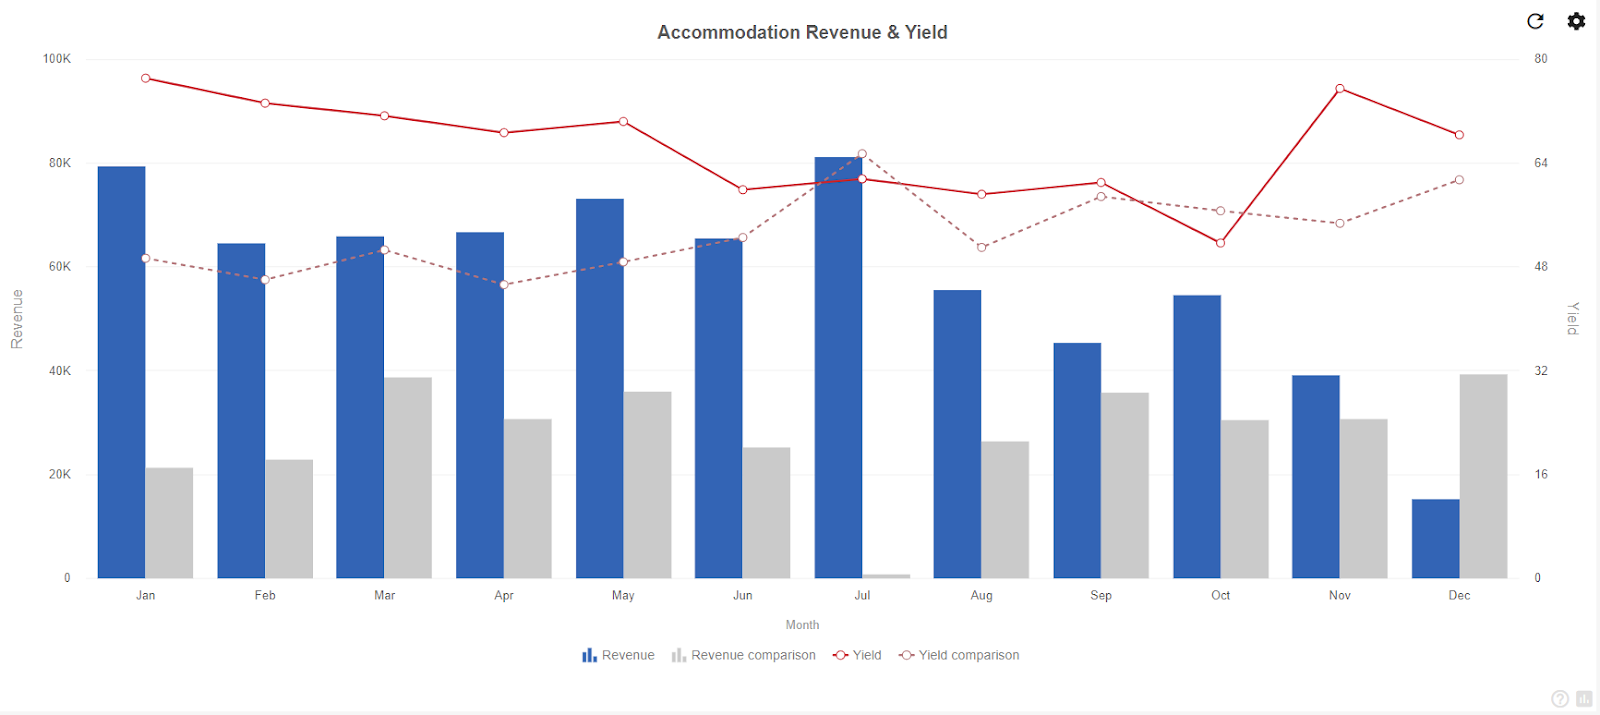
You can show and hide information by clicking on each item at the bottom of the chart.
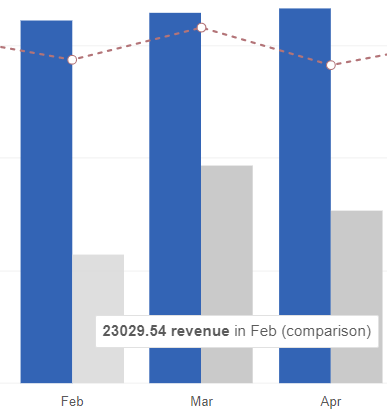
If you hover your mouse over the chart, you’ll see popups with the actual figures, so you can quickly compare the results:
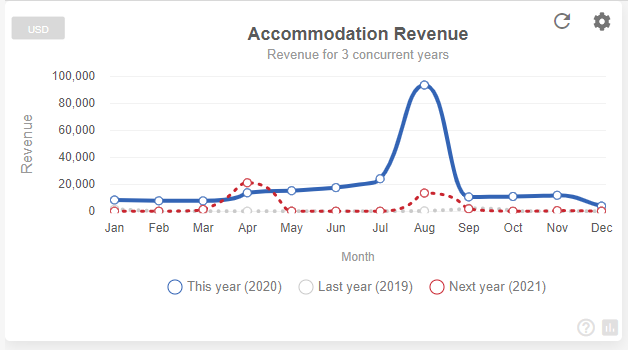
Accommodation Revenue chart
The accommodation revenue report compares revenue for 3 concurrent years. It’s a great way to quickly compare performance this year compared to last year, and to see the current projections on performance for the following year.
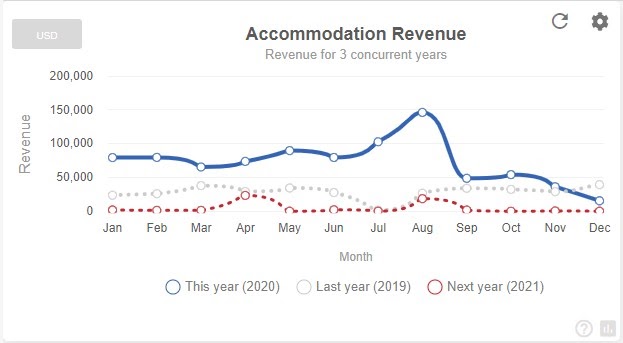
Here is an example of the Accommodation revenue chart for confirmed bookings only, with just the Rack rate:
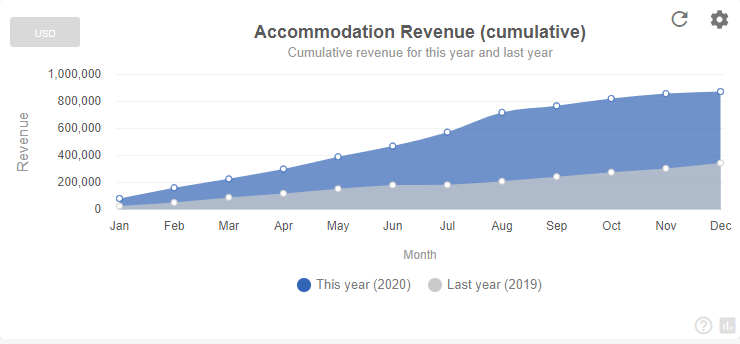
Accommodation Revenue (Cumulative)
The Accommodation Revenue (Cumulative) chart displays revenue accumulated over time. What this means, is that if we look at revenue for the month of January it will show us revenue accumulated from the 1st to the 31st of Jan, then if we look at revenue in February it will show us revenue from the 1st of Jan to the 28/29th of February and so on.
Accommodation Occupancy
The Accommodation Occupancy chart displays achieved vs potential occupancy by room or bed night. It’s a quick way to see occupancy %, and how it compares to the previous year.
There are three series displayed on the chart:
- The total number of rooms (or bed nights) allocated to bookings compared with the total rooms available in that period.
- The % of total rooms (or bed nights) compared with the total rooms (or bed nights) available this year, by month.
- The % of total rooms (or bed nights) compared with the total rooms (or bed nights) available last year, by month.
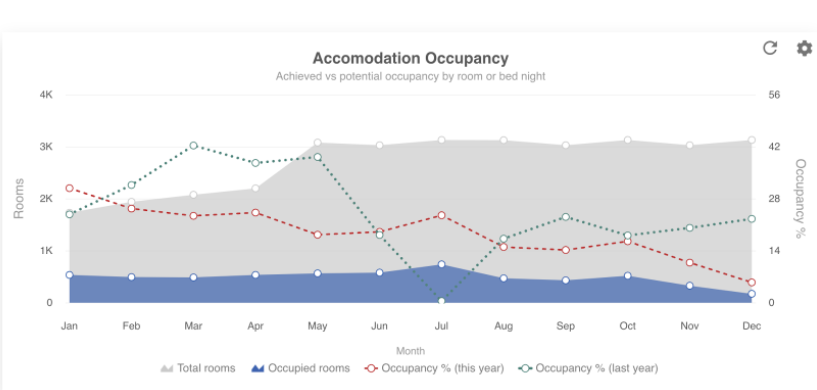
Chart filters:
Let’s have a look at the chart filter options:
To access the filters, to apply to the chart, you’ll click on the “settings” icon to access the filters menu:
![]()
You’ll then see a list of options, which you can apply to the chart.
These are the Basic Options.
Let’s have a closer look at the different settings you could apply:
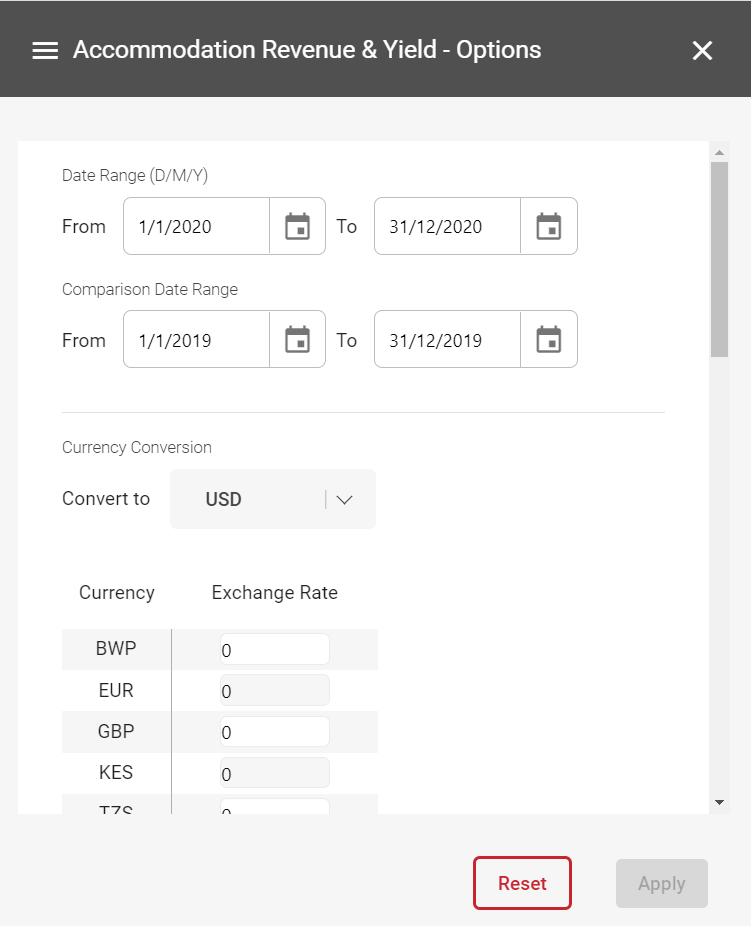
Date Range:
You can use the date range to compare the financial performance for a specific month or date range from this year, to the same time last year:
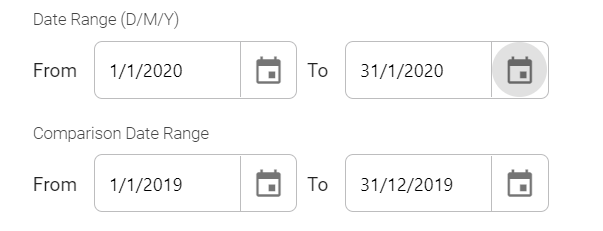
The Accommodation Revenue and Yield Chart is the only chart where you can set your own date range, as the Accommodation Revenue and Accommodation Revenue (cumulative) charts are pre-set with year on year comparisons, not defined by a specific date set.
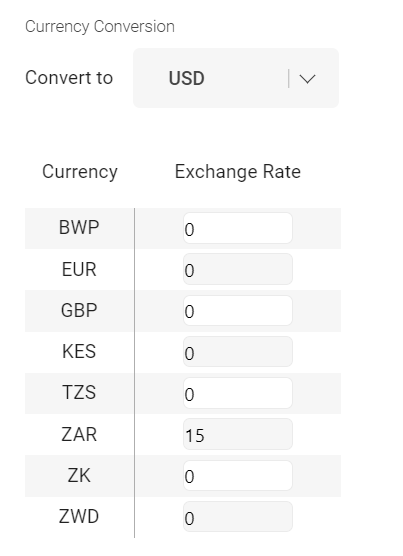
Conversion:
The conversion enables you to view the results of the chart in a specific currency. For example, if you want to see how you performed, with all currencies converted to USD, as in this example, you can insert the conversion rate for the currencies to convert to USD, and the system will display the info in USD only:
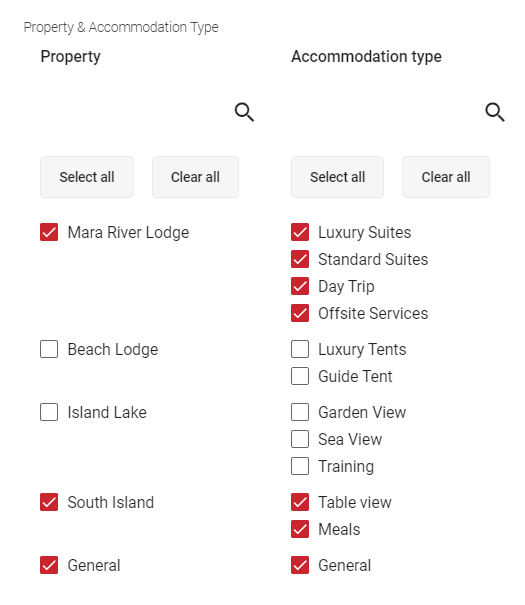
Property/Accommodation:
Use the Property Accommodation filter to select the properties and rooms you want to include in the chart. You may want to see how all properties performed, then select all. However, you may want to view the performance of a specific property, or even as specific as a particular room. For example, you may want to see how the Honeymoon Suite at a particular property is performing, compared to last year.
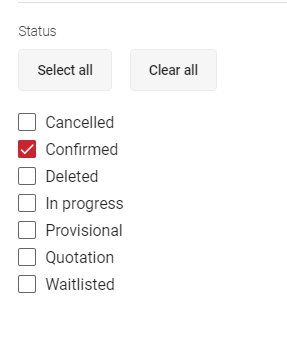
Status:
The report includes all status’ by default, however, you may prefer to only view the financial stats on your confirmed bookings. You can do this by specifying which status to include:
These are the basic report filters. You can also access a menu of Financial Filters, so you can really hone in on what you want to see.
To access the area where you can select either “Basics” or Financials” options, you would click on the triple-bar icon, at the top of the menu screen:
![]()
You will then see the option to select “Basic” or “Financials”:
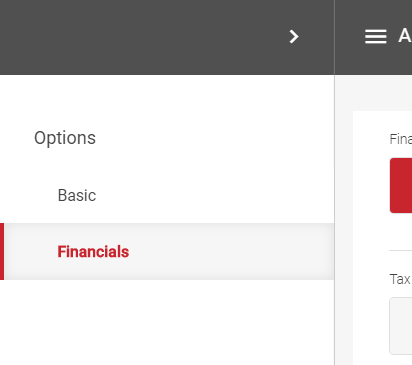
Let’s have a look at what options you have in the Financials section of the menu.
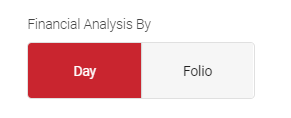
Financial Analysis By:
You can display the financials based on “Day” or “Folio” figures:
Top tip – What’s the difference between reporting “by day” or “by folio”?
If you report “by Day” – you are generating revenue figures based on specific dates.
For example, if a booking is travelling from 25 May to 05 June, and you generate a revenue report “by day” with the date range 25 May to 31 May – not all the revenue of this specific booking would be included in the results, as you will only see the revenue figures for the portions of the booking that belong to the dates in May. ie The revenue of this booking belonging to 01 – 05 June, would be excluded from your report.
If you report “by Folio” – you are generating revenue figures based on the folio dates of the booking.
For example, if a booking is travelling from 25 May to 05 June (and your system is set to default the invoice date to arrival date), and you generate a revenue report “by Folio” with the date range 25 May to 31 May – the full revenue value of this booking will be included in your report results, as the folio date applied in this instance is 25 May, the arrival date of the booking, and the full folio (all revenue) is included.
Tax:
You can display the chart results based on tax inclusive or tax exclusive figures.

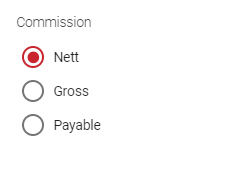
Commission:
The commission option allows you to accurately see how the commission paid out to agents affects your financials. You may want to first generate the chart showing Nett figures only, and then re-do the chart showing Gross figures.
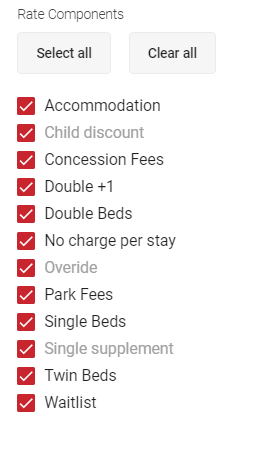
Rate Components:
You may have some revenue-generating items that are built into your rates as components. These would be items like activities or levies that are built into the rate.
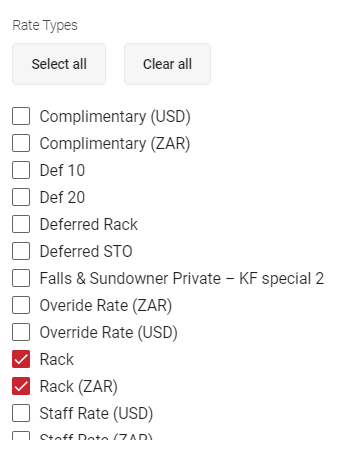
Rate Types:
By default, the chart will include all your rate types. However, you may want to see how your Rack rate performed and then separately, how one of your negotiated agent rates have performed. You can select exactly which rate types to include using this filter.
Apply to ALL:
To change options across all the charts at the same time, click on the global Options icon on the top right, set your required filters and apply changes.