ResRequest Support
  • Home
  • Modules
    • Central Reservations
    • Channel Management
    • Customer Relationship Management
    • Business Intelligence
    • Property Management
    • Financial Management
  • Latest News
    • Webinars
    • Coffee Chats
    • Professional Services
    • Product Releases
    • Technical Alerts
  • For System Administrators
    • Developer
    • System Setup
    • Technical Tips
  • Add-On Products
    • ResConnect
    • ResNova
    • ResInsite
  • Product
    • ResRequest Enterprise
    • ResConnect
  • Contact Us
  • Menu Menu

Overview

Overview

If your job is to stay on top of everything, you’ll love ResRequest’s Dashboards, which present a consolidated view of all your data on charts. To start working with dashboards, update your team’s User Access permissions to include Dashboards relevant to them.


To access your Dashboards, you’ll click on the Dashboards icon, in your main toolbar:

You’ll then access the Dashboards screen, where you’ll notice tabs at the top of the screen, to access the different Dashboard types:

  • NOTE

    You’ll only be able to view and access the Dashboards that you have access to.

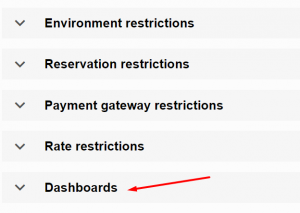
    In the User Access area, there is a heading with a dropdown option, for Dashboards:

    You can give users access to individual charts that are relevant to them. For example, if the user only needs access to the “Arrivals without full payment” chart – then it’s possible for them to only have access to that one chart.

    To find out more about user access and how to set up user groups, have a look at User Access.

What you need to know when looking at the charts:

Icons:

You’ll notice these two icons, on the bottom right-hand corner of all the charts:

If you hover your mouse over the “Question Mark” icon, you’ll see an explanation of what this chart does, or what information you are viewing. Here’s an example, from the “Arrivals without Full Payment“ chart:

If you hover your mouse over the “Bar Graph” icon, you’ll get a set of instructions on how to generate the report manually. Please do keep in mind, that some of the stats are derived directly from your database, so for some charts, you’ll need a combination of a few reports to generate the information. Here’s an example, from the “Arrivals without full payment” chart:

Refresh:

The refresh icon is available on the top right-hand side of each chart:

This allows you to update your chart, to display the most recent set of information. A refresh should be done if you’ve been viewing a chart for a long amount of time and if changes have been made on your system which affect the chart.

Popups:

If you hover your mouse over the information displayed on the chart, you will get a popup, with the figures or more information about what you are viewing. Here’s an example from the “New bookings created by consultant” chart:

Toggle:

Some of the charts show different sets of data on the same chart, so you can easily compare. You can select or de-select what information you wish to see. Here’s an example of the toggle, on the “New bookings performance by consultant” chart:

In this example, the user only wanted to see the data from last week, so the other options have been de-selected:

The user then wanted to see both last week, and the week before that. So, they selected both options, in the toggle below the chart:

What is the difference between a Dashboard, and a Chart?

A Dashboard is a central area containing graphical representation, at a glance, of key performance indicators (charts, stats etc), relevant to a particular business area.

A chart is a specific set of information in the form of a table, graph, or diagram.

So, if you are working on your ResRequest Dashboards, you’re essentially viewing an area full of charts. There is no need for you to sit for hours to manipulate info – the charts do it for you!

BUSINESS INTELLIGENCE

Getting Started

  • Overview

Dashboards

  • Working with Dashboards

Dashboards in ResRequest

  • tourism.today charts
  • How to sign-up to tourism.today
  • Product Usage Dashboards
  • Sales Overview Dashboard
  • Reservation Management Dashboard

Tourism.Today Charts

  • tourism.today Dashboards
  • Sales & Travel Movements
  • Travel Routes
  • Travel Behaviour
  • Occupancies
  • Booking Tempo
  • Yield, Lead Times & Materialisation

Keep up to date with us

Subscribe to our blog
Atta Logo    Satsa

Menu

  • Home
  • Product Releases
  • Contact Us
  • Technical Alerts
  • Coffee Chats
  • Webinars
  • Professional Services
  • Email Series 2022
  • Webinars Index
  • Email Series 2023

Privacy policy
Terms of use
Fair use policy

Visit our website

ResRequest website

ResRequest Modules

  • Business Intelligence
  • Central Reservations
  • Channel Management
  • Customer Relationship Management
  • Developer
  • Email Series 2022
  • Email Series 2023
  • Financial Management
  • Marketing tools
  • Payment Gateways
  • Point of sale
  • Product
  • Professional Services
  • Property Management
  • ResConnect
  • ResInsite
  • ResNova
  • System Setup
  • Technical Alerts
  • Technical Tips
  • Telephone Management
  • Webinars Index
© Copyright - ResRequest Support - Enfold WordPress Theme by Kriesi
The Modern Rooming CalendarReservation Management Dashboard
Scroll to top

This site uses cookies. By continuing to browse the site, you are agreeing to our use of cookies.

Accept settingsView SettingsIgnore

Cookie and Privacy Settings


How we use cookies

We may request cookies to be set on your device. We use cookies to let us know when you visit our websites, how you interact with us, to enrich your user experience, and to customize your relationship with our website.

Click on the different category headings to find out more. You can also change some of your preferences. Note that blocking some types of cookies may impact your experience on our websites and the services we are able to offer.

Essential Website Cookies

These cookies are strictly necessary to provide you with services available through our website and to use some of its features.

Because these cookies are strictly necessary to deliver the website, refusing them will have impact how our site functions. You always can block or delete cookies by changing your browser settings and force blocking all cookies on this website. But this will always prompt you to accept/refuse cookies when revisiting our site.

We fully respect if you want to refuse cookies but to avoid asking you again and again kindly allow us to store a cookie for that. You are free to opt out any time or opt in for other cookies to get a better experience. If you refuse cookies we will remove all set cookies in our domain.

We provide you with a list of stored cookies on your computer in our domain so you can check what we stored. Due to security reasons we are not able to show or modify cookies from other domains. You can check these in your browser security settings.

Other external services

We also use different external services like Google Webfonts, Google Maps, and external Video providers. Since these providers may collect personal data like your IP address we allow you to block them here. Please be aware that this might heavily reduce the functionality and appearance of our site. Changes will take effect once you reload the page.

Google Webfont Settings:

Google Map Settings:

Google reCaptcha Settings:

Vimeo and Youtube video embeds:

Accept settingsClose